그날
모든 엔드포인트가 타임아웃이었습니다. Fly의 헬스체크는 critical이었고, 로그인도 안 됐습니다. 내가 알아차리고 머신을 수동으로 재시작할 때까지 한 시간 넘게 그 상태였습니다. 재시작하자마자 정상으로 돌아왔습니다.
재시작으로 복구된다는 것은 중요한 단서였습니다. 코드 버그가 아니라 상태가 꼬인 것이고, 그 상태를 프로세스가 스스로 풀지 못했다는 뜻이기 때문입니다.
무엇이 서버를 멈췄나
HikariCP가 흔적을 남겨 두었습니다.
leaked connection PgConnection@... on thread eventLoopGroupProxy-4-1
was returned to the pool (unleaked) path=/healtheventLoopGroupProxy는 Netty의 이벤트 루프 스레드입니다. JDBC 커넥션이 이벤트 루프 스레드 위에서 열려 있었다는 뜻입니다.
이 앱의 DB 접근은 전부 newSuspendedTransaction(Dispatchers.IO)로 이벤트 루프를 벗어납니다. 딱 하나, /health만 예외였습니다. 헬스체크는 "풀이 커넥션을 줄 수 있는가, Postgres가 SELECT 1에 답하는가"를 확인하는 짧은 쿼리라서, 핸들러 안에서 블로킹 JDBC를 그냥 불렀습니다.
평소엔 문제가 없습니다. 풀이 마르면 달라집니다.
- 커넥션 풀이 마른다. 그날의 직접 계기는 지금도 정확히 모른다. 기억으로는 다른 도구를 이 서버에 붙여 두고 잊은 것이 원인이었던 것 같지만, Fly 로그는 24시간이면 사라지고 당시 메트릭 수집도 끊겨 있어서 확인할 기록이 남아 있지 않다. 느린 쿼리, 누수, 순간 폭주, 무엇이든 될 수 있다.
/health가 커넥션을 얻으려고connectionTimeout3초, 쿼리에queryTimeout3초를 기다린다. 그동안 이벤트 루프 스레드 하나가 묶인다.- 이 VM은 shared CPU 1개라 이벤트 루프 스레드가 극소수다.
- Fly 헬스체크는 30초마다 온다. 남은 루프 스레드까지 차례로 잠식된다.
- 이벤트 루프가 전부 묶이면 DB와 무관한 요청까지 받지 못한다. 서버 전체가 응답 불능이 된다.
- 풀을 되살릴 요청도 처리하지 못하니, 스스로 빠져나올 길이 없다.
풀 고갈은 방아쇠였고, 사고를 한 시간짜리로 만든 것은 헬스체크가 이벤트 루프를 점유하는 구조였습니다. 풀이 마르는 일은 언젠가 또 생깁니다. 그때 서버가 3초 뒤 503을 돌려주느냐, 통째로 멈추느냐가 이 한 줄에 달려 있었습니다.
왜 아무도 몰랐나
Fly의 http_service 헬스체크는 실패해도 머신을 재시작하지 않습니다. 로드밸런서에서 빼기만 합니다. 머신 1대짜리 서비스에서 그것은 "서비스 전체가 조용히 빠진다"는 뜻입니다.
알림도 없었습니다. 배포 스크립트에 Telegram·Slack 알림이 붙어 있었지만 토큰이 설정돼 있지 않아 배포 알림조차 무음이었고, 애초에 그 스크립트는 배포 머신에서 도는 것이라 런타임 장애를 알릴 수 없었습니다.
고친 것
1. 헬스체크를 IO 디스패처로 뺐습니다.
get("/health") {
    try {
        // JDBC 는 블로킹이다. 이벤트 루프에서 직접 부르면 커넥션 획득과
        // 쿼리 동안 루프 스레드가 묶인다. 반드시 IO 디스패처로 뺀다.
        withContext(Dispatchers.IO) {
            ds.connection.use { conn ->
                conn.createStatement().use { st ->
                    st.queryTimeout = 3
                    val rs = st.executeQuery("SELECT 1")
                    require(rs.next() && rs.getInt(1) == 1)
                }
            }
        }
        DbHealthWatchdog.recordSuccess()
        call.respond(HttpStatusCode.OK, HealthResponse(status = "ok", db = true))
    } catch (e: Exception) {
        DbHealthWatchdog.recordFailure(e)
        call.respond(HttpStatusCode.ServiceUnavailable,
            // 헬스체크는 인증 없이 열려 있다 — 예외 메시지에 JDBC URL·호스트가
            // 실려 나간다. 종류만 알린다(자세한 내용은 로그에 남는다).
            HealthResponse(status = "unhealthy", db = false, error = e::class.simpleName ?: "unknown"))
    }
}
이제 풀이 말라도 /health는 3초 뒤 503을 돌려주고, 이벤트 루프는 다른 요청을 계속 받습니다.
2. DB 회복 불능이면 스스로 재시작합니다. DbHealthWatchdog는 헬스체크 연속 실패를 세다가 6회(30초 간격이니 약 3분)면 프로세스를 종료합니다. Fly는 죽은 프로세스를 재시작 정책대로 다시 띄우고, 풀은 초기화됩니다. 수동 재시작으로 복구된다는 것을 그날 확인했으니, 그 복구를 사람이 아니라 프로세스가 하게 만든 것입니다.
임계값은 일부러 보수적으로 잡았습니다. 일시적인 DB 지연으로 재시작이 반복되면 오히려 가용성이 나빠집니다. 산발적 실패로는 절대 발동하지 않도록 테스트로 고정했습니다. 감지 3분에 재시작과 JVM 기동을 더하면 총 다운은 약 5분으로 봅니다. DB 자체가 죽으면 여전히 수동 복구입니다.
3. 같은 종류의 버그를 하나 더 찾았습니다. Apple 로그인 검증이 appleid.apple.com/auth/keys로 블로킹 HTTP를 타는데, 호출부가 디스패처 없이 부르고 있었습니다. Apple 로그인 한 건마다 이벤트 루프가 Apple 왕복 시간만큼 묶였던 것입니다. 동시 로그인 몇 건이나 Apple 응답 지연 한 번이면 같은 사고가 납니다.
함수를 suspend로 바꾸고 JWKS 조회만 withContext(Dispatchers.IO)로 감쌌습니다. 시그니처를 suspend로 만든 것은 의도적입니다. 논블로킹처럼 보이는 함수로 두면 다음 사람이 또 이벤트 루프에서 부릅니다.
4. 런타임 알림을 만들었습니다. OpsAlert가 앱 안에서 Telegram으로 알립니다. 워치독은 프로세스를 종료하기 전에 이 알림을 보냅니다. 재시작으로 조용히 복구되면 같은 일이 반복돼도 아무도 모르기 때문입니다.
이 알림은 서버 안에서 나가므로 프로세스가 완전히 멈추면 못 나갑니다. 외부 업타임 모니터는 여전히 필요합니다.
그 뒤에 한 것
사고 닷새 뒤 코드 전체를 감사했습니다. R2 객체 삭제가 동기 S3 클라이언트로 이벤트 루프에서 돌고 있었고, 같은 이유로 Dispatchers.IO로 보냈습니다. 블로킹 수정은 눈으로 검증할 수 없어서, 테스트가 삭제 호출을 가로채 실행 스레드 이름을 기록하고 세 호출 모두 DefaultDispatcher-worker에서 도는지 확인합니다. JWT 검증이 요청마다 사용자 행을 통째로 읽어 커넥션을 1–2회 더 잡는 것도 적어 두었습니다.
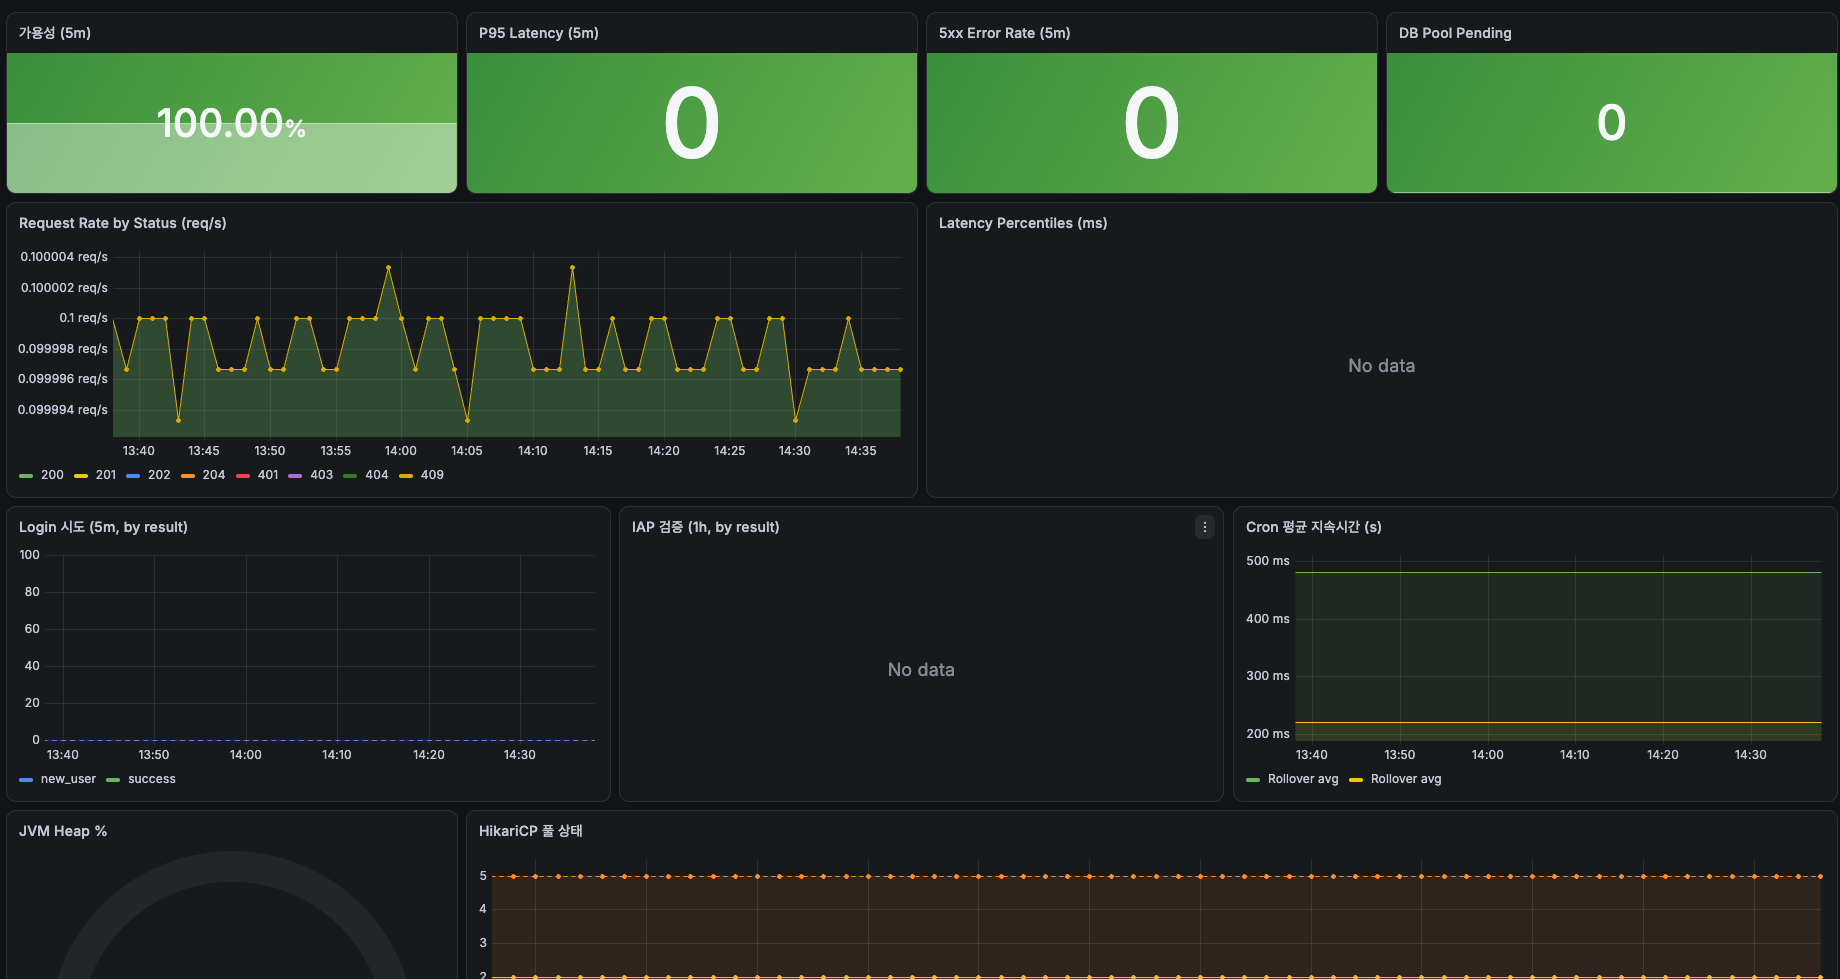
12일 뒤엔 ResourceWatchdog를 붙였습니다. 5분마다 Hikari 타임아웃 카운터와 대기 스레드 수, RSS, DB 볼륨 사용률을 읽어 풀 고갈 조짐을 Telegram으로 알립니다. 타임아웃이 올랐다는 것은 이미 사용자에게 503이 나갔다는 뜻이라, 사고 전이 아니라 사고 초기에 알게 됩니다. 알림은 정상에서 위험으로 바뀔 때만 보내고, 위험이 이어지면 6시간에 한 번, 회복되면 한 번 더 보냅니다. 새 메트릭 시리즈는 하나도 만들지 않고 기존 값을 읽기만 합니다. 장애 당일 저녁에 고친 것이 둘이었기 때문입니다. 서버를 멈춘 블로킹 호출과, 24분 뒤 그 장애를 볼 수 있어야 했던 메트릭 파이프라인(Grafana 무료 한도 초과, 서로 인과는 없음). 시리즈 예산은 그때부터 민감한 숫자였습니다.
같은 날 풀 크기도 기본값 10에서 5로 명시했습니다. 운영 문서의 공식(코어당 3)대로면 3이지만, 쿼리가 짧고 flycast 왕복 대기가 있어 공식보다 조금 크게, vCPU 1개에 과대한 기본값 10보다는 작게 잡았습니다.
배운 것
코루틴 서버에서 블로킹 호출 하나는 "그 요청이 느려진다"가 아니라 **"서버가 멈춘다"**입니다. 특히 헬스체크처럼 주기적으로 오는 경로가 블로킹이면, 장애가 생겼을 때 복구를 돕는 게 아니라 못을 박습니다.
그리고 머신이 1대인 서비스에서 "로드밸런서에서 뺀다"는 "서비스가 없어진다"입니다. 플랫폼의 헬스체크가 무엇을 하고 무엇을 하지 않는지는 사고 전에 읽어 두어야 합니다. 나는 사고 후에 읽었습니다.
That day
Every endpoint was timing out. Fly's health check was critical, and logins failed. It stayed that way for over an hour, until I noticed and restarted the machine by hand. It came back immediately.
That it recovered on restart was the important clue. This was not a code bug. It was state that had wedged, and the process could not unwedge itself.
What stopped the server
HikariCP had left a trace:
leaked connection PgConnection@... on thread eventLoopGroupProxy-4-1
was returned to the pool (unleaked)   path=/health
eventLoopGroupProxy is a Netty event-loop thread. A JDBC connection had been opened on an event-loop thread.
Every database access in this app goes through newSuspendedTransaction(Dispatchers.IO), off the event loop. Every one except /health. The health check is a tiny query ("can the pool hand me a connection, does Postgres answer SELECT 1"), so it called blocking JDBC straight from the handler.
Normally harmless. When the pool runs dry, it is not.
- The connection pool runs dry. I still do not know exactly what drained it that day. My best recollection is that I had pointed another tool at this server and forgotten about it, but Fly logs are gone after 24 hours and metrics collection was cut off at the time, so there is no record to check. A slow query, a leak, a burst: it could have been any of them.
/healthwaits up toconnectionTimeout(3s) for a connection andqueryTimeout(3s) for the query. For that time, one event-loop thread is pinned.- This VM has one shared CPU, so there are only a handful of event-loop threads.
- Fly's health check arrives every 30 seconds. One by one, the remaining loop threads get pinned too.
- With every loop thread pinned, the server cannot accept any request, even ones that never touch the database. Total unresponsiveness.
- It cannot serve the requests that would let the pool recover, so there is no way out.
Pool exhaustion was the trigger. What turned it into an hour-long outage was a health check that occupied the event loop. Pools will run dry again someday. Whether the server returns a 503 after three seconds or freezes entirely came down to this one line.
Why nobody knew
Fly's http_service check does not restart a machine when it fails. It only removes it from the load balancer. On a one-machine service, that means "the whole service quietly disappears."
There were no alerts either. The deploy script had Telegram and Slack hooks, but no tokens were configured, so even deploy notifications were silent. And that script runs on the deploy machine anyway; it could never report a runtime failure.
What I fixed
1. Moved the health check onto the IO dispatcher.
get("/health") {
    try {
        // JDBC blocks. Called directly on the event loop, it pins a loop thread
        // for the whole connection acquire + query. Always push it to IO.
        withContext(Dispatchers.IO) {
            ds.connection.use { conn ->
                conn.createStatement().use { st ->
                    st.queryTimeout = 3
                    val rs = st.executeQuery("SELECT 1")
                    require(rs.next() && rs.getInt(1) == 1)
                }
            }
        }
        DbHealthWatchdog.recordSuccess()
        call.respond(HttpStatusCode.OK, HealthResponse(status = "ok", db = true))
    } catch (e: Exception) {
        DbHealthWatchdog.recordFailure(e)
        call.respond(HttpStatusCode.ServiceUnavailable,
            // The health check is unauthenticated — exception messages carry the
            // JDBC URL and host. Report only the type; details stay in the logs.
            HealthResponse(status = "unhealthy", db = false, error = e::class.simpleName ?: "unknown"))
    }
}
Now when the pool is dry, /health returns 503 after three seconds and the event loop keeps serving everything else.
2. Self-restart when the database cannot be recovered. DbHealthWatchdog counts consecutive health-check failures and, at six (30-second interval, so about three minutes), exits the process. Fly restarts a dead process per its restart policy, and the pool is rebuilt from scratch. I had just confirmed that a manual restart fixes it, so the fix is to let the process do that instead of a human.
The threshold is deliberately conservative. If transient database latency caused restart loops, availability would get worse, not better. A test pins down that sporadic failures never trigger it. Three minutes to detect plus restart and JVM boot puts total downtime at about five minutes. If the database itself dies, recovery is still manual.
3. Found one more bug of the same class. Apple sign-in verification fetches appleid.apple.com/auth/keys over blocking HTTP, and the caller invoked it with no dispatcher. Every Apple login pinned an event-loop thread for one round trip to Apple. A few concurrent logins, or one slow response from Apple, would reproduce the outage.
The function became suspend, with only the JWKS fetch wrapped in withContext(Dispatchers.IO). Making the signature suspend was deliberate: leave it looking non-blocking and the next person calls it from the event loop again.
4. Built runtime alerting. OpsAlert sends to Telegram from inside the app. The watchdog alerts before it exits the process. If a restart silently fixes things, the same failure can repeat forever and nobody learns.
This alert leaves from inside the server, so it cannot fire if the process is completely frozen. An external uptime monitor is still needed.
What followed
Five days later I audited the whole codebase. R2 object deletion was running on the event loop through a synchronous S3 client; it went to Dispatchers.IO for the same reason. You cannot verify a blocking fix by looking at it, so the test intercepts the delete call, records the executing thread's name, and checks that all three calls run on DefaultDispatcher-worker. I also noted that JWT validation reads the full user row on every request, holding a connection one or two extra times.
Twelve days later I added ResourceWatchdog. Every five minutes it reads Hikari's timeout counter and pending-thread count, RSS, and database volume usage, and sends a pool exhaustion warning to Telegram. A rising timeout count means users have already received 503s, so this catches the incident early in its course, not ahead of it. It alerts only on the transition from healthy to at-risk, re-alerts every six hours while the condition persists, and sends one recovery message. It creates no new metric series; it only reads existing values. That mattered because two things were fixed on the evening of the outage: the blocking call that froze the server, and 24 minutes later, the metrics pipeline that should have shown it (the Grafana free-tier overrun, unrelated in cause). The series budget had been a sensitive number ever since.
The same day, the pool size went from the default 10 to an explicit 5. The ops doc's formula (3 per core) says 3; with short queries and flycast round-trip waits, 5 sits a little above the formula and well below a default of 10 that was oversized for one vCPU.
What I learned
In a coroutine server, one blocking call does not mean "that request gets slow." It means "the server stops." And when the blocking path is something periodic like a health check, it does not help recovery during an incident. It nails the coffin shut.
And on a one-machine service, "removed from the load balancer" means "the service is gone." What the platform's health check does and does not do is something to read before the incident. I read it after.