증상
매달 중순을 지나면 Grafana 대시보드가 빈 화면이 됐습니다. 서버는 멀쩡했고, 로그도 들어왔습니다. 메트릭만 끊겼습니다.
Grafana Cloud 무료 티어는 활성 메트릭 시리즈 1만 개까지입니다. 그리고 과금은 순간값이 아니라 월 평균입니다. 한 번 치솟으면 그 달 내내 잘린 채로 갑니다. 이 두 가지를 몰라서 한동안 "어쩌다 끊기는 것"으로 넘겼습니다.
첫 번째 원인 — 히스토그램 버킷 (8월 14일)
처음 한도를 넘긴 날, 프로덕션 /metrics를 직접 세어 봤습니다. 재시작 직후라 라우트 조합이 2개뿐인 상태였는데도 이랬습니다.
| 항목 | 시리즈 |
|---|---|
| 전체 | 229 |
그중 ktor_http_server_requests_seconds_bucket | 138 (60%) |
Micrometer의 percentilesHistogram(true)는 route × method × status × address × throwable 조합 하나마다 버킷을 약 69개 만듭니다. 조합당 72 시리즈. 조합 139개면 한도가 찹니다. 엔드포인트가 100개인 API에서는 금방입니다.
두 가지를 바꿨습니다.
percentilesHistogram(false), 대신 앱에서 계산한 p50·p95·p99만 내보냅니다. 조합당 72 → 6 시리즈.address라벨 제거. 값이<머신ID>:8080이라 재배포할 때마다 같은 라우트가 새 시리즈로 갈라졌습니다. 머신이 1대인데 정보 가치가 없었습니다.
잃는 것은 histogram_quantile로 임의 분위수를 다시 계산하거나 히트맵을 그리는 것뿐입니다. 병목을 찾는 데 쓰는 p95는 그대로 남습니다.
고친 날 대시보드의 p50/p95/p99 패널은 여전히 _bucket을 읽고 있었습니다. 버킷을 없앴으니 그 패널 3개는 그날부터 빈 그래프였고, 이걸 알아챈 건 12일 뒤였습니다. 이 글을 쓰는 지금도 그 패널은 고치지 않았습니다. histogram_quantile 대신 앱이 내보내는 quantile 라벨을 읽도록 바꿔야 합니다. 메트릭을 줄일 때는 그걸 읽는 쿼리도 같이 세어야 합니다.
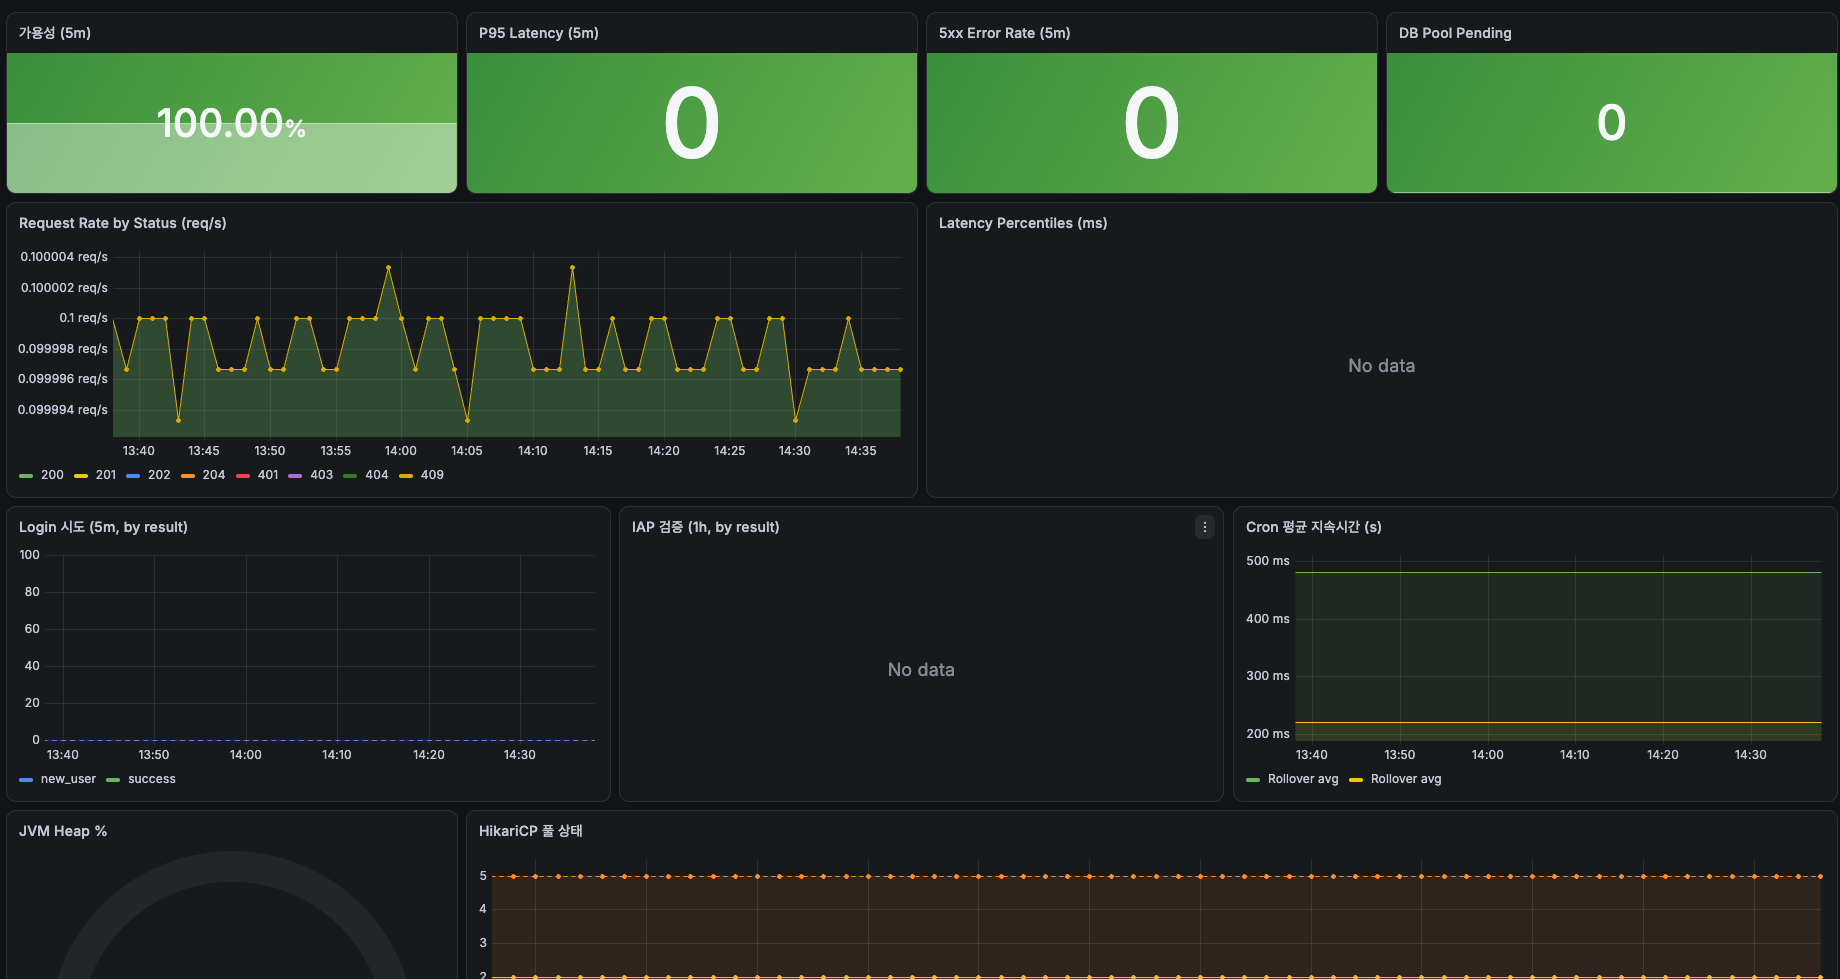
두 번째 원인 — 스캐너 경로가 라벨이 됐다 (8월 26일)
버킷을 없앤 지 12일 만에 또 끊겼습니다. 같은 달이었습니다. 이번엔 조직 전체 사용량부터 확인했습니다. 스택은 하나, Logs·Traces·Profiles는 0GB, 메트릭만 20K. 다른 프로젝트 탓이 아니라 이 앱이었습니다.
Grafana Explore로 시리즈 수를 시간축으로 보니 모양이 톱니였습니다. 배포 직후 42개, 며칠 뒤 2,600개, 다시 배포하면 0. 앱 전체로는 4,000–5,000개를 오갔고, 8월 10일부터 14일 사이엔 14–15K까지 치솟아 있었습니다.
서버 /metrics에서 범인을 봤습니다.
ktor_http_server_requests_seconds_count{method="GET",route="/_rNd9xZ7kL3",status="404"} 1
ktor_http_server_requests_seconds_count{method="GET",route="/wp-admin/setup-config.php",status="404"} 1
ktor_http_server_requests_seconds_count{method="GET",route="/.env",status="404"} 1api.piano.nariinfo.dev는 공개 API라 취약점 스캐너가 임의 경로를 끊임없이 두드립니다. Ktor 메트릭 플러그인의 기본값 distinctNotRegisteredRoutes = true는 매칭되지 않은 요청의 실제 경로를 그대로 route 라벨에 넣습니다. 경로 하나에 6 시리즈(count·sum·max + 분위수 3개). 인터넷 배경 소음이 그대로 관측 비용이 되고 있었습니다.
배포마다 리셋되는 톱니라서 순간값은 늘 한도 아래였고, 그래서 오래 눈에 띄지 않았습니다.
수정 — 한 줄
// ① 레지스트리 — address 라벨은 여기서 버린다 (8/14 수정)
val appMicrometerRegistry: PrometheusMeterRegistry =
    PrometheusMeterRegistry(PrometheusConfig.DEFAULT).apply {
        config().meterFilter(MeterFilter.ignoreTags("address"))
    }

// ② 분포 설정 — 버킷을 만들지 않는다 (8/14 수정)
val httpTimerDistributionConfig: DistributionStatisticConfig =
    DistributionStatisticConfig.Builder()
        .percentilesHistogram(false)
        .percentiles(0.5, 0.95, 0.99)
        .build()

// ③ install — 미등록 경로를 접는다 (8/26 수정, 이 한 줄)
install(MicrometerMetrics) {
    registry = appMicrometerRegistry
    distributionStatisticConfig = httpTimerDistributionConfig
    distinctNotRegisteredRoutes = false
}
미등록 경로가 route="n/a" 하나로 접힙니다. 시리즈 수가 스캐너 트래픽이 아니라 API 표면적(엔드포인트 수)에 묶입니다. 계산상 한도의 10–15%로 내려갑니다.
한 줄이지만 부수효과는 표로 확인했습니다.
| 대상 | 영향 |
|---|---|
| 대시보드 쿼리 18개 | route를 쓰는 것 0개(전부 sum 집계) → 없음 |
status 라벨 | 그대로 → 성공률·에러율 패널 무사 |
| 앱 내부 경보 | HTTP 메트릭을 읽지 않음(hikaricp.*만) → 없음 |
| 등록된 라우트의 404 | 템플릿 유지 → /api/v1/songs/{id}의 "리소스 없음" 신호 보존 |
| 잃는 것 | 스캐너가 어떤 경로를 두드렸는지. 쓰는 곳 없음 |
테스트로 못 박기
설정값 하나는 다음 사람이(또는 다음 달의 내가) 쉽게 되돌립니다. 그래서 테스트 2건으로 고정했습니다.
@Test
@DisplayName("스캐너가 두드린 미등록 경로는 라벨 하나로 접힌다 — 요청 수는 보존")
fun unmatchedRoutesCollapseToSingleLabel() {
    val junk = listOf(
        "/_rNd9xZ7kL3", "/wp-admin/setup-config.php", "/.env",
        "/phpmyadmin/index.php", "/actuator/health",
    )
    val (before, lines) = requestCountLines { client -> junk.forEach { client.get(it) } }

    junk.forEach { path ->
        assertTrue(lines.none { routeOf(it) == path }, "미등록 경로가 라벨로 남았다: $path")
    }
    // 이 블록이 새로 만든(또는 늘린) GET 미등록 시리즈만 본다.
    val beforeCounts = byLabels(before)
    val grew = byLabels(lines).filter { (labels, count) ->
        routeOf(labels) == "n/a" && labels.contains("""method="GET"""") &&
            count > (beforeCounts[labels] ?: 0.0)
    }
    assertEquals(1, grew.size, "미등록 경로는 시리즈 하나로 합쳐져야 한다")
    val (labels, count) = grew.entries.single()
    assertEquals(junk.size.toDouble(), count - (beforeCounts[labels] ?: 0.0),
        "요청 수까지 잃으면 안 된다 — 라벨만 접는다")
}

@Test
@DisplayName("등록된 라우트는 404 여도 템플릿이 남는다 — 리소스 없음 신호 보존")
fun registeredRouteKeepsTemplateEvenOn404() { /* /api/v1/songs/{id} → 404 → route 라벨은 템플릿 */ }
첫 번째 테스트는 처음에 route="n/a" 시리즈 개수를 1로 못 박았다가 깨졌습니다. 메트릭 레지스트리가 JVM 전역이라, 다른 테스트가 GET이 아닌 메서드로 404를 한 번 만들면 그 시리즈까지 보였기 때문입니다. 절대값이 아니라 이 블록이 만든 증분을 보도록 고쳤습니다. 히스토그램 버킷 쪽은 MetricsCardinalityTest 5건이 지킵니다(버킷 없음, 분위수 유지, address 제거, 아래 화이트리스트 2건). 카디널리티를 지키는 테스트는 모두 7건입니다.
하지 않은 것
- 카디널리티 상한(
maximumAllowableTags): 엔드포인트가 100개라 상한을 50으로 두면 정상 라우트 절반이 조용히 사라집니다. 게다가 무엇이 살아남을지가 재시작 후 요청 도착 순서에 좌우돼 배포마다 달라집니다. - 스크랩 30초 → 60초: 과금 시리즈가 정확히 절반이 되지만, 위 수정만으로 충분히 내려가서 해상도를 잃을 이유가 없습니다. 다시 빠듯해지면 꺼낼 카드로 남겼습니다.
- 유료 전환: 계산상 사용량이 한도의 10–15%라 시기상조입니다.
배운 것
관측 비용은 트래픽이 아니라 라벨 카디널리티로 결정됩니다. 이번 사고는 사용자가 늘어서가 아니라, 외부 입력이 라벨에 닿는 경로를 막지 않아서 생겼습니다.
사실 같은 구조를 이보다 먼저 막아 둔 곳이 있었습니다. 8월 14일 장애 닷새 뒤 코드 전체를 감사하면서, 클라이언트가 보내는 role·difficulty 문자열을 검증 없이 Prometheus 태그로 쓰는 곳을 찾았습니다. 인증된 사용자가 랜덤 문자열을 반복 POST하면 시리즈가 무한히 늘어나는 구조였습니다. role 2종, difficulty 4종의 허용 집합 밖은 other로 접어 조합 상한을 3 × 5로 묶었고, 막는 위치는 라우트가 아니라 메트릭 함수로 두었습니다. 호출자가 늘어도 안전하기 때문입니다. 테스트는 쓰레기 값 50종을 던져 라벨 집합이 화이트리스트와 other뿐인지 확인합니다.
8월 26일에 스캐너 원인을 적으면서 이 수정을 선례로 인용했습니다. 감사가 사고를 한 번 앞질렀던 셈입니다.
외부 입력이 라벨에 닿는 경로는 전부 접거나 화이트리스트로 막는다. 두 번 당하고 남긴 규칙입니다.
Symptom
Past the middle of every month, the Grafana dashboard went blank. The server was fine. Logs kept flowing. Only metrics stopped.
The Grafana Cloud free tier allows 10,000 active metric series. And billing is on the monthly average, not the instantaneous value. One spike and you are cut off for the rest of the month. I did not know either of these things, so for a while I filed it under "flaky."
First cause — histogram buckets (August 14)
The first time we went over, I counted the production /metrics output by hand. The app had just restarted, so only two route combinations existed. Even so:
| Item | Series |
|---|---|
| Total | 229 |
of which ktor_http_server_requests_seconds_bucket | 138 (60%) |
Micrometer's percentilesHistogram(true) creates about 69 buckets for every route × method × status × address × throwable combination. That is 72 series per combination. 139 combinations fill the quota. On an API with 100 endpoints, that happens fast.
Two changes:
percentilesHistogram(false), exporting only app-computed p50, p95 and p99 instead. 72 → 6 series per combination.- Drop the
addresslabel. Its value was<machine-id>:8080, so every redeploy split the same route into a new series. With one machine, it carried no information.
What we lose is recomputing arbitrary quantiles with histogram_quantile, and heatmaps. The p95 we use to find bottlenecks stays.
On the day of the fix, the dashboard's p50/p95/p99 panels were still reading _bucket. With buckets gone, those three panels had been empty since that day, and I only noticed twelve days later. As I write this they are still not fixed: they need to read the app-exported quantile label instead of histogram_quantile. When you cut a metric, count the queries that read it too.
Second cause — scanner paths became labels (August 26)
Twelve days after the buckets were gone, we were cut off again. Same month. This time I started from the org-wide usage page. One stack. Logs, traces, profiles all at 0 GB. Metrics at 20K. No other project to blame. It was this app.
Plotting series count over time in Grafana Explore showed a sawtooth. 42 right after a deploy, 2,600 a few days later, back to zero on the next deploy. The app as a whole hovered at 4,000–5,000, and between August 10 and 14 it had spiked to 14–15K.
The server's own /metrics showed the culprit:
ktor_http_server_requests_seconds_count{method="GET",route="/_rNd9xZ7kL3",status="404"} 1
ktor_http_server_requests_seconds_count{method="GET",route="/wp-admin/setup-config.php",status="404"} 1
ktor_http_server_requests_seconds_count{method="GET",route="/.env",status="404"} 1
api.piano.nariinfo.dev is a public API, so vulnerability scanners hammer it with random paths around the clock. Ktor's metrics plugin defaults to distinctNotRegisteredRoutes = true, which puts the literal path of every unmatched request into the route label. Six series per path (count, sum, max, three quantiles). Internet background noise was being turned directly into observability cost.
Because the sawtooth reset on every deploy, the instantaneous value was always under the limit. That is why it hid for so long.
The fix — one line
// ① Registry — the address label is dropped here (Aug 14 fix)
val appMicrometerRegistry: PrometheusMeterRegistry =
    PrometheusMeterRegistry(PrometheusConfig.DEFAULT).apply {
        config().meterFilter(MeterFilter.ignoreTags("address"))
    }

// ② Distribution config — no buckets (Aug 14 fix)
val httpTimerDistributionConfig: DistributionStatisticConfig =
    DistributionStatisticConfig.Builder()
        .percentilesHistogram(false)
        .percentiles(0.5, 0.95, 0.99)
        .build()

// ③ install — collapse unregistered paths (Aug 26 fix, this one line)
install(MicrometerMetrics) {
    registry = appMicrometerRegistry
    distributionStatisticConfig = httpTimerDistributionConfig
    distinctNotRegisteredRoutes = false
}
Every unmatched path now folds into a single route="n/a". The series count is tied to the API surface (number of endpoints), not to scanner traffic. On paper that brings usage down to 10–15% of the quota.
One line, but I checked the side effects in a table.
| Target | Effect |
|---|---|
| 18 dashboard queries | None use route (all sum aggregates) → none |
status label | Unchanged → success-rate and error-rate panels fine |
| In-app alerts | Do not read HTTP metrics (only hikaricp.*) → none |
| 404 on a registered route | Template kept → /api/v1/songs/{id} still signals "not found" |
| What we lose | Which paths scanners probed. Nothing reads that |
Locking it in with tests
A single config flag is easy for the next person (or next month's me) to flip back. So two tests pin it down.
@Test
@DisplayName("Unregistered paths hit by scanners collapse to one label — request count preserved")
fun unmatchedRoutesCollapseToSingleLabel() {
    val junk = listOf(
        "/_rNd9xZ7kL3", "/wp-admin/setup-config.php", "/.env",
        "/phpmyadmin/index.php", "/actuator/health",
    )
    val (before, lines) = requestCountLines { client -> junk.forEach { client.get(it) } }

    junk.forEach { path ->
        assertTrue(lines.none { routeOf(it) == path }, "unregistered path leaked into a label: $path")
    }
    // Only the GET series this block created or grew.
    val beforeCounts = byLabels(before)
    val grew = byLabels(lines).filter { (labels, count) ->
        routeOf(labels) == "n/a" && labels.contains("""method="GET"""") &&
            count > (beforeCounts[labels] ?: 0.0)
    }
    assertEquals(1, grew.size, "unregistered paths must merge into one series")
    val (labels, count) = grew.entries.single()
    assertEquals(junk.size.toDouble(), count - (beforeCounts[labels] ?: 0.0),
        "request count must survive — only the label collapses")
}

@Test
@DisplayName("A registered route keeps its template even on 404 — the not-found signal survives")
fun registeredRouteKeepsTemplateEvenOn404() { /* /api/v1/songs/{id} → 404 → route label is the template */ }
The first test originally asserted that exactly one route="n/a" series exists, and it broke. The meter registry is JVM-global, so when another test produced a single 404 with a non-GET method, that series leaked in. It now checks the delta produced by this block, not absolute values. The histogram side is guarded by the five cases in MetricsCardinalityTest (no buckets, quantiles kept, address dropped, and the two allow-list cases below). Seven tests in total guard cardinality.
What I deliberately did not do
- A cardinality cap (
maximumAllowableTags): with 100 endpoints, a cap of 50 silently drops half the real routes. Worse, which ones survive depends on request arrival order after restart, so it changes on every deploy. - Scrape interval 30s → 60s: that exactly halves billable series, but the fix above already brought us far enough down that there is no reason to give up resolution. It stays in the back pocket.
- Paying: at a calculated 10–15% of quota, too early.
What I learned
Observability cost is driven by label cardinality, not traffic. This incident was not caused by user growth. It was caused by leaving a path where external input could reach a label.
In fact, the same structure had already been blocked once before this. Five days after the August 14 outage, while auditing the whole codebase, I found a place where client-supplied role and difficulty strings went straight into a Prometheus tag with no validation. An authenticated user POSTing random strings could grow series without bound. Anything outside the allow-list (two roles, four difficulties) now folds into other, capping the combinations at 3 × 5, and the guard lives in the metrics function rather than the route, so it stays safe no matter how many callers appear. The test throws 50 kinds of junk at it and checks that the label set is exactly the allow-list plus other.
When I wrote up the scanner cause on August 26, I cited that fix as the precedent. The audit had, for once, gotten ahead of an incident.
Every path where external input touches a label gets collapsed or allow-listed. That is the rule two incidents left behind.